
: failed to open stream: Invalid argument in <b>/home/servuzmq/minisites/siteT1/common/template/carteV2.php</b> on line <b>139</b><br />
)
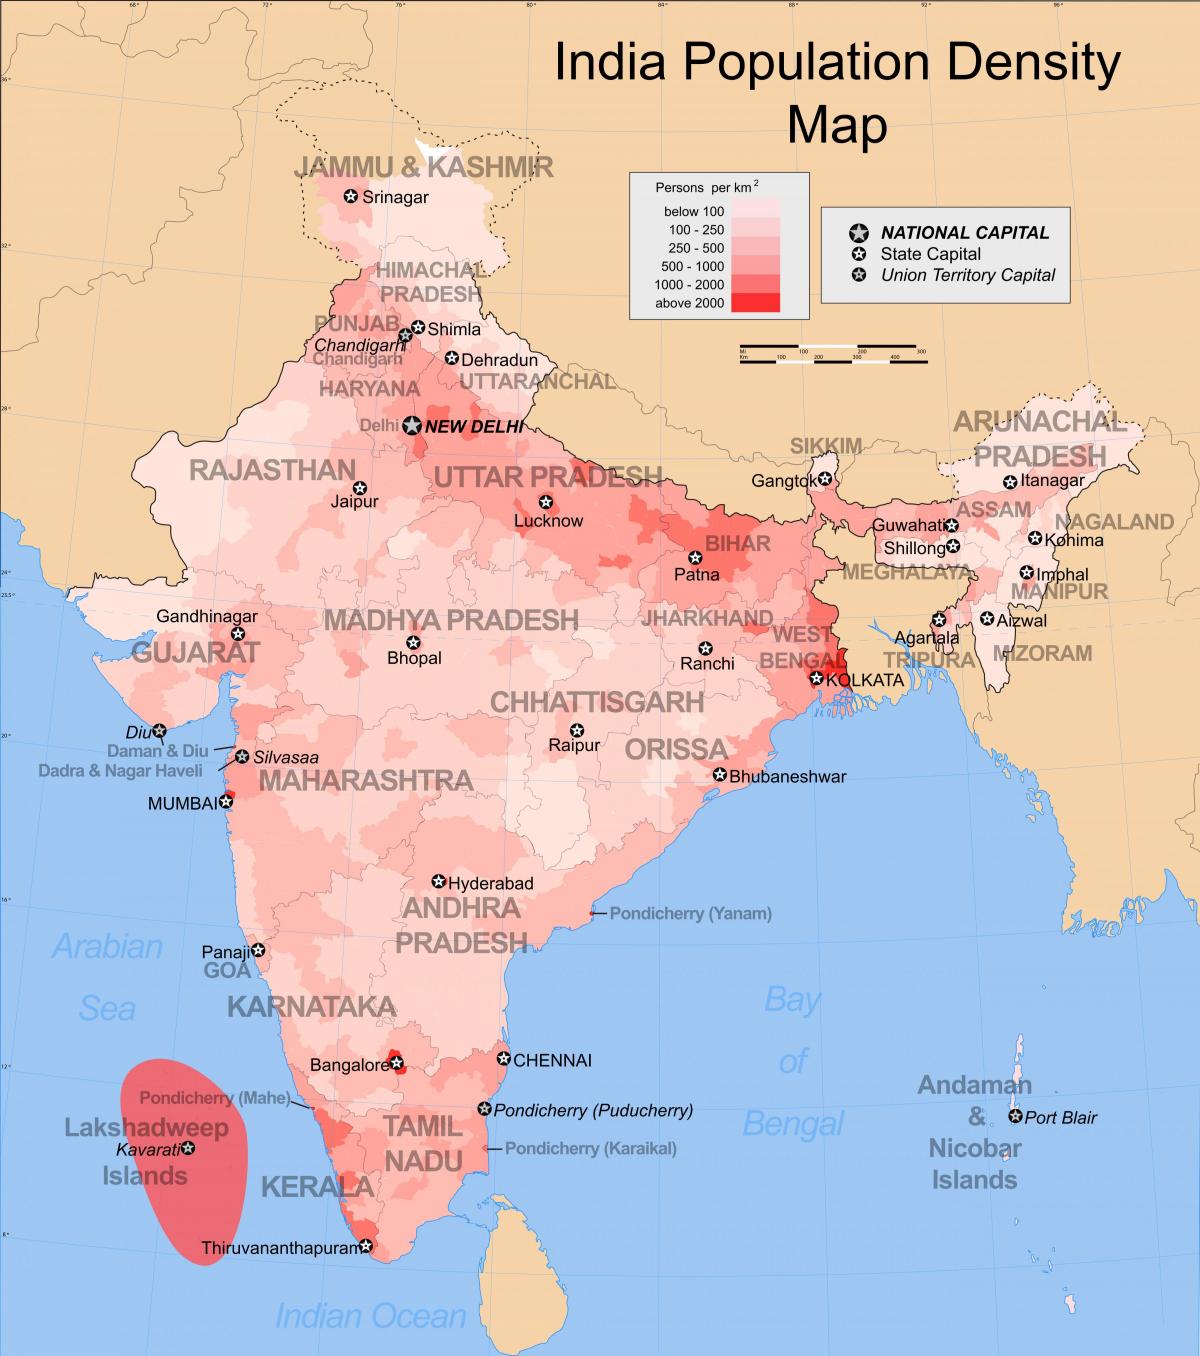
You can find on this page the India population map to print and to download in PDF. The India population density map presents the number of inhabitants in relation to the country size and the structure of the population of India in Asia.
The India population density map shows the number of inhabitants in relation to India size. This demographic map of India will allow you to know demography and structure of the population of India in Asia. The India density map is downloadable in PDF, printable and free.
The demographics of India are inclusive of the second most populous country in the world, with over 1.21 billion people (2011 census), more than a sixth of the world population. Already containing 17.5% of the world population density, India is projected to be the world most populous country by 2025, surpassing China, its population reaching 1.6 billion by 2050. Its population growth rate is 1.41%, ranking 102nd in the world in 2010 as its mentioned in India population density map.
India has more than 50% of its population density below the age of 25 and more than 65% hovers below the age of 35. Indian life revolves mostly around agriculture and allied activities in small villages, where the overwhelming majority of Indians live (see India population density map). As per the 2001 census, 72.2% of the population lives in about 638,000 villages and the remaining 27.8% lives in more than 5,100 towns and over 380 urban agglomerations.
In 2018, the population density in India amounted to about 454.94 inhabitants per square kilometer as you can see in India population density map. The density of population was decreased in between 2001 and 2011. NCT of Delhi with population density 11, 297 is the most thickly populated UT. Among the states, Bihar is on the top of the list with a population density of 1,102 in 2011.
